BigFix Asset Network Maps
BigFix Asset Network Maps is a dashboard that uses BigFix data to provide views of the underlying network structure of a user's deployment.
Note: White boxes represent IP addresses in this diagram .
Traceroute
The structure of the map is built up primarily from what are effectively traceroute results from the client to its relay. These traceroutes are conducted during relay selection, and their results are exposed through the relevance:
gateway addresses of selected server
These traceroute results give us a path of devices and connections between the client and the client's relay. We also get a path between each relay and its parent relay or root server. Using this data, we build a map of the connections between computers and devices in the deployment. Although the data is directional, we generally do not display it that way, because the map is intended to show network connections, rather than BigFix hierarchy.
Default Gateways
The traceroute information is supplemented by default gateway information. This data is retrieved using the relevance:
gateways of adapters of network
If the traceroute returns a path of 0 hops, this means that the relay is on the same subnet as the client. However, for our map this means that there should really be a path of length 1, where the single hop is the gateway that both the client and relay are connected to. In this case we use the default gateway as the single hop in the path.
Duplicate IP Resolution
It is common for many subnets to use the same IP space, and many routers to have the same IP address within a deployment. Given that the information that we are using to determine the network structure is usually just IP addresses, there is no certain way to determine whether two gateways in our data with the same IP address are actually the same device or two devices with the same IP address. To address this issue, we use the following scheme:
We look at the path that each of the two gateways in question use to reach their relay, and we find the first hop between the gateway and the relay that has an IP address outside the private IP space. If the first public IP address that we find of each gateway is the same, then we consider the gateways to actually be the same device. This scheme is not perfect, but is based in the idea that most networks will have a single link to the internet, or to the public IP space. So, if two devices both share the same connection and the same IP address, they are likely the same device; and if they don't share the same connection, they are likely different devices in different subnets.
Network Visualization
There are two main views associated with the network map dashboard, an overview, and a subnet view.
Overview
This is the main view of the visualization. It primarily shows roots, relays, and subnets, although individual computers may show up if they do not fall neatly into a subnet. This view is generated from the network map data in 2 phases:
Path Contraction PhaseIn the first phase, long strands within the graph are removed. For example, if there were a set of nodes and edges A-B-C-D, where A and D both have 3 or more edges connected to them, but B and C only have the two edges shown, then this path will be contracted to simply A-D. The logic here is that in the overview of the graph, the exact path taken between two nodes is not as important as the fact that they are connected. The contracted nodes are displayed as blue dots along the path A-D, but do not affect the layout algorithm.
Subnet Generation PhaseIn the second stage, subnets are computed in the graph, where a subnet is defined by the IP address of the device to which all computers in the subnet are connected. All computers that have only a single edge (after path contraction) are removed from the graph, and are considered as part of the subnet defined by the device to which their single edge connects them. The size of the subnet in the overview is determined by the number of computers in the subnet.
Subnet View
You enter this view when you double-click a node in the graph, or right-click on a node and select View Subnet Nodes. The view displays all nodes that are considered to be part of the subnet defined by the node that you chose. Paths that were contracted for the overview are displayed as their full path in the close-up view.
Available Maps
The 1.0 release of BigFix Asset Network Maps contains 6 different maps that each convey different information to the user.
Relay Selection Maps
Currently there are four available maps showing relay selection.
Relay Network Topology MapThis map displays the relative locations of relays and root servers in the user's deployment. It reflects the location of relays relative to the gateways and devices that connect them in the network. It does not reflect the relay hierarchy.
Relay Hierarchy MapThis map displays the hierarchy of relays and roots in a user's deployment. It is the only map that does not reflect network topology.
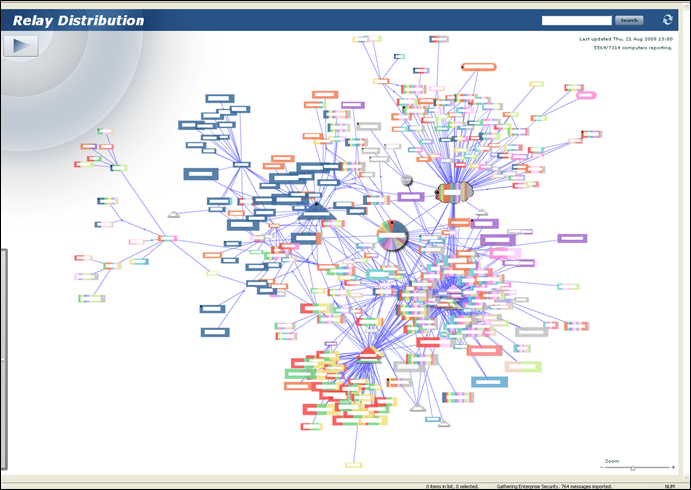
Relay Distribution MapThe structure of this map reflects the entire network structure of a deployment that is visible to the BigFix infrastructure. Nodes are colored based on the relay to which they are connected.
Relay Selection Method MapThe structure of this map reflects the entire network structure of a deployment that is visible to the BigFix infrastructure. Nodes are colored based on whether their relay selection methods are manual or automatic.
Bandwidth Throttling Maps
Curently there are two available maps showing bandwidth throttling.
Dynamic Bandwidth Throttling MapThe structure of this map reflects the entire network structure of a deployment that is visible to the BigFix infrastructure. Nodes are colored based on whether or not dynamic bandwidth throttling is enabled.
Static Bandwidth Throttling mapThe structure of this map reflects the entire network structure of a deployment that is visible to the BigFix infrastructure. Nodes are colored based on the degree of static bandwidth throttling. Red is the most throttled, green is the least. The scale of the colors is relative to the highest level of throttling on any computer in the deployment.